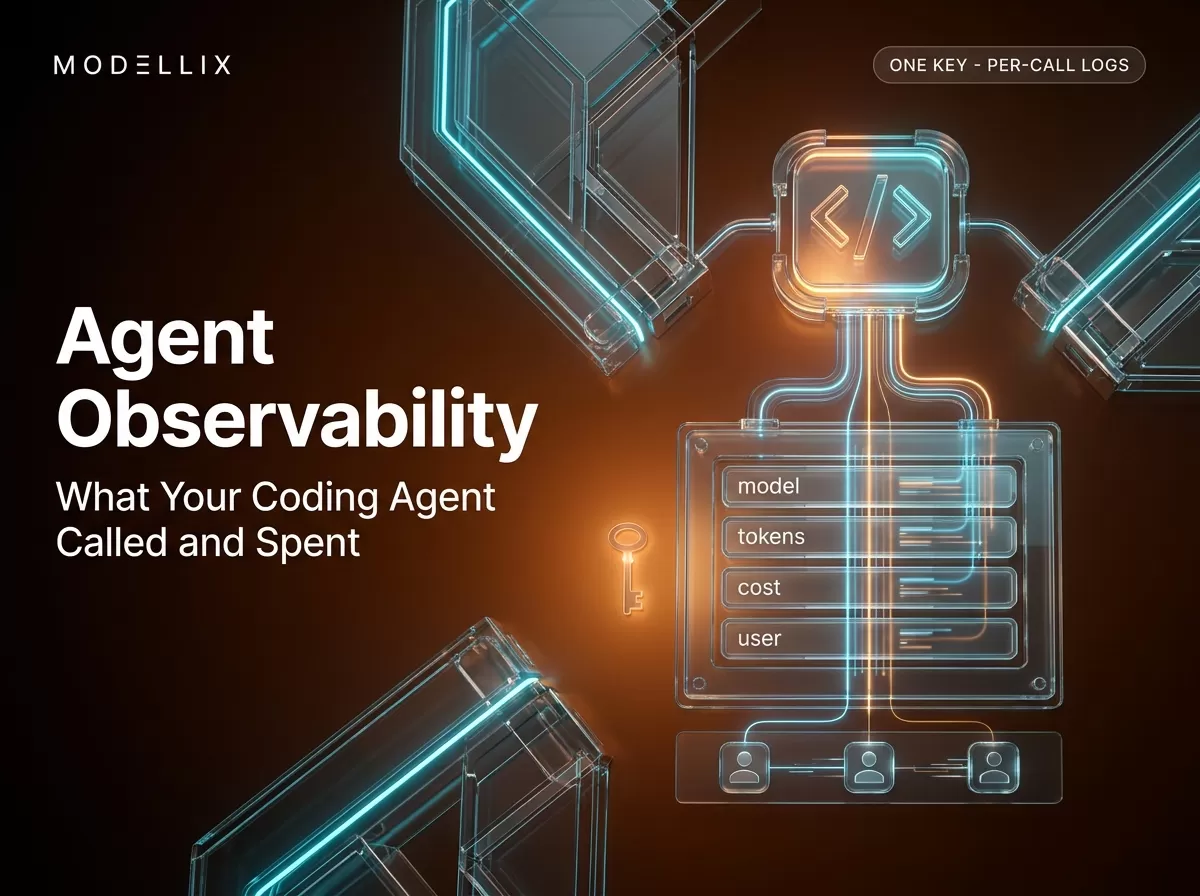
Your team runs a coding agent inside DeepSeek Harness. It edits files, runs tests, retries failed steps, and by Friday the invoice arrives with a total nobody can explain. The agent’s own logs live on the developer’s laptop, so “what did it actually call, and who spent what” has no answer that survives a handover — and the question is only going to get more expensive as more of your work happens through agents.
Agent observability is the practice of making an agent’s internal state and behavior visible through logs, metrics, and traces — Google Cloud’s documentation frames it as methods for gaining insight into software agents, particularly LLM-powered ones, across model calls, tool usage, reasoning, and cost. This article is a selection guide for that stack: it maps where agent signals actually live, what each layer can and cannot see, and how to choose a starting point — including the layer most guides skip, the request logs your model gateway already keeps. Endpoint behavior was verified against Modellix’s LLM gateway documentation on September 3, 2026. Modellix operates one such gateway, so we have a commercial interest in the gateway-log option working for you; the boundaries below are drawn from the documentation either way. Two scope notes up front: what one run costs and how to read it field by field is the sibling article on DeepSeek Harness token usage, and what unit prices are is a separate pricing comparison across LLM APIs — here we are choosing the layer that sees calls and spend.
What agent observability is supposed to make visible
Observability for a normal service rests on three pillars — logs, metrics, and traces — and agent observability builds on the same pillars while adding the dimensions that make agents unlike normal services: they are non-deterministic, they choose their own steps, and they can regress silently. Azure’s agent observability guide makes the split explicit: traditional observability covers infrastructure health, latency, and throughput; agent observability adds evaluation and governance on top, because the interesting questions are about decisions and outcomes, not just failures.
Concretely, the field agrees you want visibility into four things:
- Model calls — which model served each request, how many tokens it consumed, how long it took, and what it cost. This is the layer that touches your bill directly.
- Tool calls — which tools or functions the agent invoked (file edits, test runs, web fetches), with their arguments and results.
- Behavior and reasoning — the loop: why the agent chose this path, what order steps ran in, where it looped or retried.
- Outcome quality — whether outputs stayed correct over time, which usually means evaluations rather than raw telemetry.
Everything you read about agent observability — every vendor page, every platform docs page — organizes itself around these four. The Hugging Face agents course defines traces as a complete task and spans as the individual steps inside it, then lists the metrics tools typically monitor: latency, cost per run, request errors, user feedback, accuracy. The consensus is real, and it is also where the guidance stops: almost nobody tells you where each of these four views is actually produced, and that omission is what turns “we should observe our agents” into a six-month instrumentation project.
The three layers where agent signals actually live
Step back from the tooling and ask where the data physically sits. For any agent, signals appear in one of three places — and each place sees a different slice:
Layer 1 — the client that runs the agent. The harness, IDE extension, or agent process itself. DeepSeek Harness, a plugin-based agent harness that runs locally, keeps its session data, trajectory, and model configuration on the machine that runs it — the official documentation describes a local-first tool where even credentials live in a $DSH_HOME directory. This layer has the richest view: it knows every tool call, every loop iteration, every retry. It also has the shortest reach: it is a single developer’s machine. There is no team-level server holding it, no shared query, no central cost column.
Layer 2 — the model gateway the agent calls through. If your agent is routed through a model gateway or aggregator instead of talking to a dozen vendor endpoints directly, that gateway keeps a server-side log of every request that crossed it — regardless of which client made the call. Because the gateway sits between the agent and the models, its records carry what the client’s local logs don’t: the model that actually served each request, the billed token counts, and the cost. You get this layer for free in the sense that no instrumentation is required — the requests already pass through it. A unified-API explainer covers why teams route through one in the first place.
Layer 3 — an SDK-based tracing platform. Langfuse, Arize, Datadog, and the rest of that category add an SDK or OpenTelemetry instrumentation to your agent code, and traces of the agent’s execution — spans for model calls, tool calls, retrieval steps — stream to a dashboard with evals, alerts, and team workflows. This layer is the only one that can show you Layer-1-style loop detail centrally, but it is also the only one that demands you build the plumbing: instrument every agent you want to see, keep the SDKs maintained, and send it whatever you decide is worth sending.
Most agent observability content assumes Layer 3 is the only real option — instrument, trace, evaluate. That assumption skips a cheaper question: what do you already hold? If your agents already run through a gateway, Layer 2 exists on day one with zero SDK work. The honest framing is a trade, not a hierarchy: Layer 3 shows you the loop; Layer 2 shows you the money. Deciding which of those you actually need is the whole selection problem.

Three layers, three views: the client sees the whole loop but only locally; the gateway sees every model call server-side without instrumentation; tracing platforms see instrumented spans centrally.
What a gateway request-log layer covers — and what it cannot
Here is where precision matters, because the gap between “request logs” and “observability” is where this layer gets oversold. Modellix’s LLM gateway exposes GET /v1/logs, and its API reference is unusually explicit about what the endpoint does and does not return. It “lists LLM request logs for the authenticated team within a time window,” optionally filtered by the end-user id sent as X-Mdlx-User-Id on inference, and it runs on the query rate limit — a separate quota from inference. Per request, the log returns the model that served the call (model.provider and model.model_name), the token split (prompt_tokens, completion_tokens, cached_tokens), a cost field, status and timing fields, and — conditionally — the payloads.
The capability boundary, stated as Modellix documents it:
| What a gateway log row tells you | How (Modellix GET /v1/logs) |
|---|---|
| Which model actually served each call | model.provider + model.model_name per request |
| How many tokens each call consumed | prompt_tokens / completion_tokens / cached_tokens |
| What each call was billed | cost per request, in the billing unit |
| When it happened, and whether it succeeded | created_at, status, error |
| Which end-user’s requests these were | filter by mdlx_user_id (exact match against X-Mdlx-User-Id sent on inference) |
| Time window and paging | start_time / end_time required, span ≤ 30 days; page_size default 10, max 100 |
| What the client sent and got back | input / result — returned only when retained |
Now the boundary, which is the part expert readers will check: this layer sees the model-call layer and nothing above it. Tool calls, agent loop iterations, retrieval steps, and the reasoning that chose a path are not in gateway logs — the gateway never sees them, because they happen inside the agent before and between model calls. A cost spike in the logs tells you that a step burned tokens; it does not tell you which tool or why. Anyone who presents gateway logs as complete agent observability is overstating the layer, and this article does not: for loop-level questions you need Layer 3 instrumentation, and the two layers complement rather than replace each other.
Three documented caveats matter if you build on top of these logs. First, input and result are conditional — “when retained” — and Modellix’s documentation does not state how long payloads are retained, whether retention can be disabled, or whether retained payloads are used for training, all of which are undocumented as of September 3, 2026. If your use case is prompt-level audit, treat the token counts and cost as the reliable core and verify retention with the vendor before committing. Second, rate-limit behavior is published as a category, not a guarantee: 429 responses may include X-RateLimit-* headers and Retry-After. Modellix’s entitlements documentation lists rate-limit tiers by account top-up, but it does not state that those figures apply to the LLM gateway’s inference or query quota, and the gateway documentation publishes no RPM figure for this logs endpoint — reading logs consumes query quota, separate from inference, but exact limits for the endpoint are not documented. Third, there is no published SLA, uptime commitment, or upstream-failure fallback description for the gateway, so a reliability column on this layer would be blank by documentation. The full field-by-field walkthrough of this endpoint — runnable query included — is the subject of the DeepSeek Harness token usage article linked in the introduction, which is the how-to companion to this selection guide.

The boundary in one image: gateway logs reach every model call that crosses them — and stop at the agent loop that made the calls.
Request Logs API Reference
See the exact GET /v1/logs parameter contract and response fields in the Modellix LLM gateway documentation.
View DocsPer-user attribution: the question dashboards dodge
Here is the question that separates a hobby setup from a business one: which end-user’s usage is this? If you resell agent capability to your own customers — an internal tool rebilled per team, or an agent product where your customers bring their own workloads — you need a cost line per customer, and you need it from the day you start, not after the first dispute.
Tracing platforms answer “what happened” from the spans you send them. The billing answer — what a specific customer’s requests actually cost, at the rates the gateway charged — is not a span property; it is a property of the request log at whoever served the call. Gateway request logs carry exactly that, if the requests were labeled on the way in. Modellix documents an optional X-Mdlx-User-Id header for this: 8–128 characters, letters, digits, -, and _, sent on inference, and used to filter the logs through the mdlx_user_id query parameter with exact matching. The gateway API guide documents the header and its validation. The filter is exact-match and the response rows do not include a user-id field — you filter by user rather than reading it back off each row.
In practice this makes per-user llm attribution a query, not a spreadsheet exercise: give each of your customers (or each internal team) a stable user id, have your agent send it on every request, and “what did customer X’s agents cost this month” is one filtered call against the logs. That is a B2B capability the local client logs cannot produce at all and tracing platforms only approximate if you build the billing join yourself. Whether it matters to you is a product decision: no customers to rebill, and per-user attribution is optional plumbing; customers to rebill, and it is the difference between an invoice you can defend and an argument.
Choosing a starting layer: match the question, not the tool
The selection error this category produces is buying a platform before naming the question. The decision framework is short: write down the three questions you most need answered, and let the layer that answers them pick itself.
| Your question | Layer that answers it | What you will still lack |
|---|---|---|
| “Which model did we call, and what did the calls cost?” | Gateway request logs (Layer 2) | Nothing for this question — it is the layer’s whole job |
| “What did each customer / team spend?” | Gateway request logs + per-user id (Layer 2) | A user-id convention on your requests |
| “Why did the agent take this path? Which tool did it choose?” | Tracing platform (Layer 3) | Instrumentation of every agent you want to see |
| “Did quality regress across releases?” | Tracing platform evals (Layer 3) | Eval datasets and labeling |
| “We need prompt-level audit trails” | Any layer with documented retention | A vendor that documents retention — Modellix does not, as of this writing |
Three honest notes before you spend. First, “we should observe our agents” almost always decomposes into a Layer-2 question (money, models) and a Layer-3 question (behavior, quality) — few teams need only one, and the correct architecture is usually gateway logs as the always-on floor plus tracing where loop visibility is genuinely worth instrumenting. Second, nothing here is a claim that a gateway’s logs replace a tracing platform, nor that Modellix’s logs are the most complete of any gateway — the table above is Modellix’s documented boundary, and if you use a different gateway you should read its logs documentation with the same “what is not in here” eye. Third, a practitioner thread on r/Observability makes the pragmatic case for skepticism about any single layer: once agents are in production, the hard part stops being traces and spans and becomes “figuring out what was a decision versus just execution” — the thread’s phrase for over-instrumented setups is “very well instrumented confusion.” Start with the layer that answers your money and model questions, and only instrument what the remaining questions actually require.
What this looks like for a coding agent in DeepSeek Harness
Close the loop with the scenario from the opening. Your coding agent runs in DeepSeek Harness, and Harness is pointed at the Modellix LLM gateway as a custom provider — the Modellix setup guide for DeepSeek Harness shows the settings.yaml provider block with the gateway base URL and OpenAI-compatible protocol. What changed the day you stopped guessing:
- Per-call truth, server-side. Every model call the harness made — including the retries and the long-context re-sends that blow up bills — now has a row with model, token split, and
cost. The DeepSeek Harness pillar article covers the harness itself; this logging layer is where its spend becomes auditable. - Per-developer lines. Each developer’s harness environment sends its own
X-Mdlx-User-Id, so “what did the intern’s agent cost last week” is a filter, not a forensic investigation. The custom provider walkthrough is where you would add that header. - The honest remainder. Tool selection, edit decisions, and the loop itself still live in the harness’s local logs on each machine — gateway logs will not show you which file edit preceded the expensive call. If debugging why the agent behaved that way becomes a recurring need, that is the signal to add a tracing layer for the loop, with the gateway logs kept as the cost floor. For the broader picture of coding agents as a category, the agent harness overview is a good next read.
That is the whole selection: name the question, claim the layer you already hold, and instrument only the gap.
Open the Modellix Console
Create your API key and query your own gateway request logs — per-call model, tokens, and cost, filterable by end-user.
LoginFrequently Asked Questions About Agent Observability
What does agent observability mean? It is the practice of making an AI agent’s internal state and behavior visible through logs, metrics, and traces — covering model calls, tool usage, reasoning steps, and cost. “AI agent observability,” the near-synonym you will see on vendor pages, is the same practice. Google Cloud’s agent observability documentation (linked above) defines it as methods for gaining insight into the internal state and behavior of software agents, particularly LLM-powered ones.
What are the three types of observability? The traditional pillars are logs, metrics, and traces. Azure’s agent observability guide (linked above) argues agents add two more: evaluation (did the agent do the right thing) and governance (did it stay within policy). In this article’s layer model, the relevant distinction is where signals live — client, gateway, or tracing platform — not which pillar they use.
Are gateway request logs the same as full agent observability? No. Gateway logs cover the model-call layer: which model served each request, token counts, and billed cost. Tool calls, agent-loop iterations, and retrieval steps happen inside the agent and are not visible to the gateway. For loop-level visibility you need SDK-based tracing; the layers complement each other.
Can I see which tool my agent called in gateway logs? No — tool calls never reach the gateway, so no gateway can log what it does not see. Tool calls appear in the client’s local logs (if you have access to the machine) or in a tracing platform once the agent is instrumented.
How do I attribute model costs to individual end-users? Send an end-user identifier on inference and filter the request logs by it. On Modellix, X-Mdlx-User-Id (8–128 characters, letters, digits, -, _) labels a request, and GET /v1/logs filters on it via mdlx_user_id with exact matching.
Is LLM observability the same as agent observability? LLM observability focuses on the model-call layer — prompts, completions, token usage, latency, cost — which is exactly what a gateway’s request logs capture. Agent observability is broader: it adds the tool calls, reasoning, and loop behavior that sit between model calls, which requires client or tracing-layer data.
How long are request payloads retained in the logs? Undocumented as of September 3, 2026. Modellix returns input and result fields only “when retained,” and its documentation does not state retention length, whether retention can be disabled, or whether payloads are used for training. Token counts and cost are the reliable parts of a log row; verify retention with the vendor before relying on prompt-level audit.
Do I still need a tracing tool if I use gateway logs? Only if you need answers the gateway cannot give. Cost, model, and per-user attribution questions are answered by the logs alone; “why did the agent choose this path” questions need instrumentation. Start with the layer that answers your most expensive questions, then add tracing for the gap.
Endpoints, field names, and rate-limit wording reflect Modellix public documentation as of September 3, 2026, and change as the platform evolves; validate against the live docs before committing. Access DeepSeek and 200+ other models through a single API key at modellix.ai.